


This is a reproduction of the final project report submitted as part of my Master in Marketing. The contents for the most part have remained the same as the original paper and was relevant in the context of the time it was written. Therefore it may or may not contain discrepancies in content when applied to today's standards and developments. Originally written in November 2017.
The research that follows was conducted by a group of marketing graduates of which I was a part of during my time at the Daniels College of Business at the University of Denver. This group refered to themselves as F5 Research for this project.
The United States Census Bureau estimates that 42 million U.S. residents originate from outside the U.S. One million are here as international students contributing $35.8 billion to the U.S. economy. This project aimed to discover the differences that this and other market segments of foreign residents have in regards to viewing habits, preferences and device ownership. The project also aims to determine the suitability of this segment for further market research and development. In addition, two proposals were explored that were designed to increase potential subscriber numbers and gauge interest in the sharing of premium content at additional cost.
Problem Definition
A significant number of viewers are watching more television than ever but with the new technologies available, traditional viewing habits are changing. Many TV viewers are choosing streaming services over cable, and smaller portable devices versus traditional TV sets. Comcast as a cable company is seeking strategies to adapt to these continuing changes in order to maintain and grow the cable company’s customer base.
F5 Research focused on the question of how different market segments consume media content, with the goal of determining whether residents born in the U.S. (domestics) have different viewing habits than residents born outside the U.S. (non-domestics). Findings could reveal a marketing opportunity for Comcast.
Research Process
Exploratory Research
The first step in developing the exploratory research plan was to gather secondary data relating to the 10 possible research problems defined by the client. We found multiple recent (2014 to 2016) sources of relevant studies conducted by organizations including a variety of databases, news sources, and research publications. Through the secondary data we were able to engage in informed discussions about which research problems had already been explored to some degree and how the findings aligned with or discounted our hypotheses.
Initially intending to focus on Millennials and their viewing habits, we found that there were more than ample amounts of research on this segment with little room for expansion on the existing literature. However, we did find that the data available was focused largely on the viewership habits within Western Cultures. As there was little research into the habits of foreign viewers within the US, we adjusted our focus to highlight this market segment. From our research, it was shown that there was a rise in overall cable viewership globally, but a drop in cable TV subscriptions within the US. It also suggested that there were high levels of migration to the US from these countries in the form of international students and foreign skilled workers. This allowed us to further detail our market segments in the forthcoming research.
Primary Data
Using the information gathered from our secondary research sources, a list of 14 interview questions was developed to gather more detailed information about our targeted segments. Each team member identified 3-6 respondents of either native-born Americans (domestic) or/and foreign-born (non-domestic) residents, to gather primary data. Individually, each team member interviewed their informants, recording the conversations to facilitate accurate collection of responses.
All responses were collated into a table for comparison, from which similarities and differences could be easily analyzed and key points of interest could be identified. Based on this information, we developed a series of research questions which would represent the main focus points of this research.The primary data gathered allowed for a look into the viewing habits of several members of the researched market segments. By looking at these habits, we were able to hypothesize certain behaviors and trends among the segments, leading to the isolation and identification of variables that would later form the research questions.
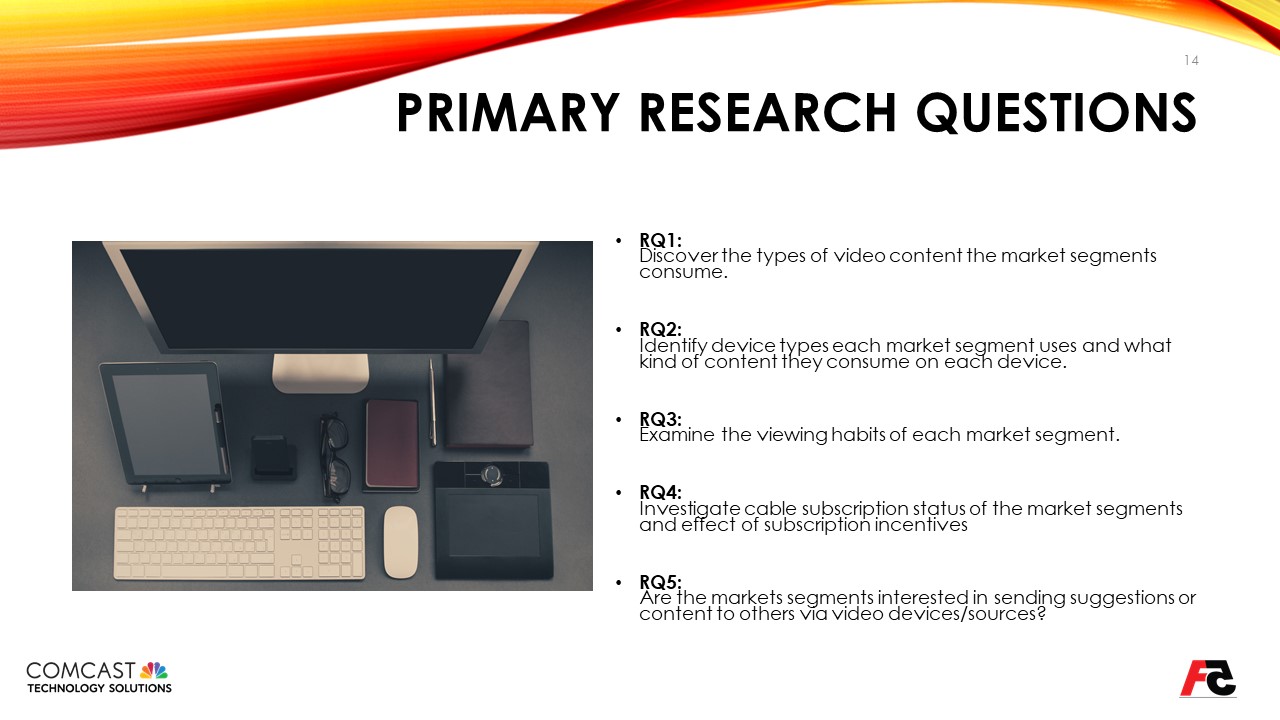
The research questions used in the final presentation were as follows:
1) Discover the type(s) of content the three market segments consume.
Based on our primary and secondary research, recent immigrants have shown that they are not likely to subscribe to cable and will prefer ethnic content that helps them feel connected to their home countries. We hypothesized that those who have been in the U.S. three years or longer will gradually begin watching more American content to better understand the local culture but will still watch ethnic content.
Our secondary research showed that Millennials were amongst the most prolific consumers of video content, with a 2013 poll rating 75% of millennials as binge viewers (Digitalsmiths, 2016). Other research put 30-40% of millennials as likely to indulge in binge viewing at least once per week (Kressmann, 2015).
2)Identify types of devices each market segment uses and what kind of content they consume on each device.
Our primary research showed 100% of domestic-born viewers as having televisions, as well as other devices to view content. None of the non-domestic respondents who have lived in the US under three years owned a television. In contrast, 60% of non-domestics who have lived in the US for over three years currently have a television, likely increasing the possibility of a subscription.

However, it is not explicitly clear whether having a television would increase subscription rates. As a result, we felt it was important to identify what and how devices were used in order to understand the consumption habits of our segments. This information could then be further developed with other data to generate a holistic approach to marketing to these segments.
3) Examine the viewing habits of each market segment.
Evidence from the primary data showed all segments engaging in multiple activities while also viewing video content. Primary data showed domestic viewers spending about 24.8 hours a week, short-term immigrant viewers spending about 33.4 hours per week, and long-term immigrant viewers spending about 11.6 hours a week. These numbers were highly related to occupation, with interviewees that were full-time students recording the highest average viewing time.
4) Investigate the cable subscription status of the market segments and whether subscription incentives would affect subscription decisions.
Looking at our primary exploratory data, only 6 out of the 21 viewers had cable in their homes; all of which were domestic viewers. High-cost was given as the reason for the lack of subscription for 6 of our respondents. With a subscription margin so low, the group hypothesized potential incentives to increase subscription rates, especially among the non-domestic viewers as much of this segment did not own equipment (e.g. TV) to subscribe to cable. This presented them with an extra hurdle to overcome should they want to subscribe.
5) Would consumers be interested in sending suggestions to others via their video devices/sources?
This question was developed based on feedback from the client in response to the research proposals submitted during the beginning of the research process. In this case the client was interested in developing an understanding of how content sharing would affect the viewership habits.
Initially, the research question that was developed based on this feedback was designed to be broad in its scope to facilitate multiple potentially relevant factors. Within the final survey, the question was geared to the idea of premium content sharing; a form of sharing focused on the distribution of premium content to non-cable subscribers.
The reasoning behind this focus was based on the idea that content sharing in its conventional form would be less applicable towards the market segments chosen. Non-domestic viewers were known to prefer ethic content when moving into a foreign culture. The hypothesis was that this predisposition to prefer more ethic media could be insightful if it meant that non-domestics could share their media with their friends and family as way to facilitate social interaction.
Results
In total, we received 149 responses from Qualtrics and 83.2% of them were valid (all questions given a response). In the valid dataset, 66.92% of participants were domestic viewers and 33.08% of them were non-domestic viewers. Furthermore, for non-domestic viewers we had 56.1% student-visa-holders, 24.4% citizens, 14.6% legal permanent residents and 4.9% with work visas. Also, in our sample a significant percentage, which is 76.15% of participants have a Bachelor’s degree and higher. A majority of them currently live in Western America.
RQ1. Discover the types of video content the market segments watch.
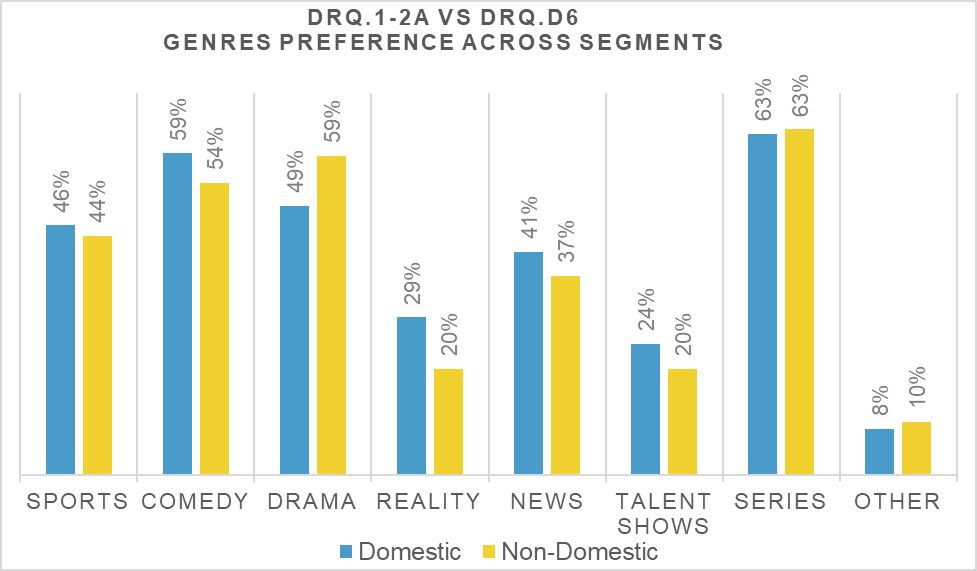
- DRQ1-2a: Genre Preference Across Segments
The first aspect of the data we looked at was related to the classifications of video content viewed by the market segments. Our first analysis focus on the genre preferences across the two groups. Based on our data, we found that overall, there was little variations between what shows were preferred by the majority of respondents. Preference genres were spearheaded by TV series, drama, and comedy shows with a variation of 5-10% between market segments.
Relevance of this data lies with how it identifies the similarity across genres and the most relevant genres. In the case that marketing efforts were to be tailored to non-domestic and domestic users, the identification of specific genres can help focus resources upon shows most likely to be viewed by the most people. For example, a marketing push for non-domestics would not likely focus on providing reality TV shows to foreign audiences as only 20% will likely become regular viewers.
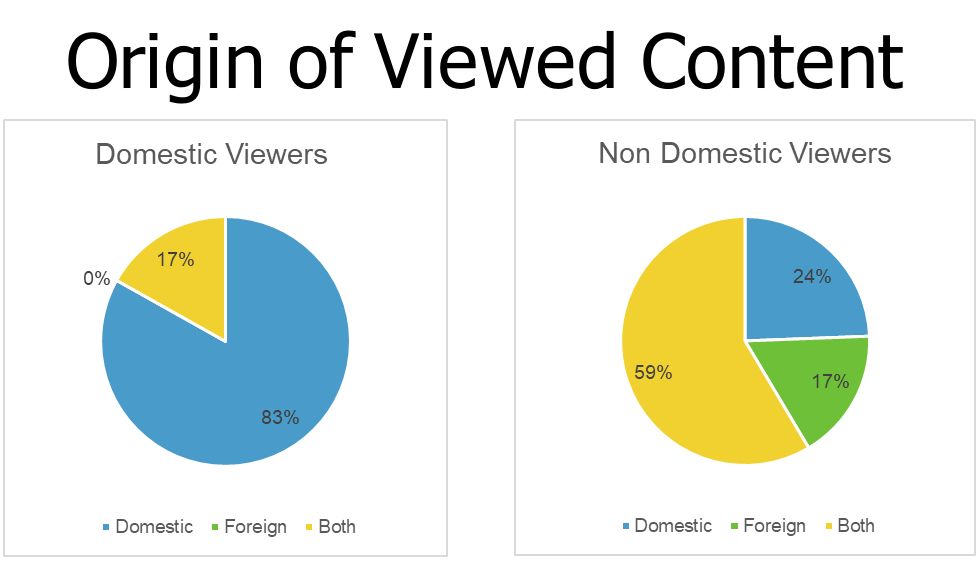


- DRQ1-2b: Origin of Viewed Content
With the identification of the genre of shows viewed discussed in the previous section, it is also important to know where this content came from. The origin of content can be equally as important to end-viewer as the type of content. Together the information provides a more detailed view of the types of shows viewed by each demographic.
By running analysis on who was watching what, it was possible to measure what the origin of the content viewed by each segment was and in what proportions. Domestic viewers were identified as having a majority watch only domestic programming produced within the U.S. Only 17% of viewers were found to watch content originating from outside the U.S. and even then this viewership was still supplemented with domestic content.Non-domestic viewers showed a more varied mix of sources in their viewing habits. The majority (59%) of the non-domestic respondents watched a mix of domestic and foreign content. 24% of this segment watched exclusively domestic content and 17% focused on exclusively foreign content (see Fig 2 for details).
Based on the information above, up to 76% of non-domestic viewers will watch foreign content to some capacity. If focus was to be aimed at targeting non-domestic viewers, this information alongside the genre preference information stated previously will provide the client with a basic framework of what types of programming to import and at what capacity. These charts also show that the import of more foreign content will unlikely change the viewing habits of domestic viewers. With only a small portion of viewers consuming the new content, it reduces the risk of upsetting the existing, largely domestic subscriber base.
- DRQ1-2b: Effect Length of Stay Has On Content Watched
With the information above, we have gained a degree of insight on the content viewing habits of our segments. However, it does not provide any indication of whether or not this is just a momentary trend or if there is a change in the viewing habits as time progresses. Although it is not possible within the scope of this research project to track changes over time; by looking at where content originates from and distributing the results based on the age of respondents, we are able to extrapolate trends of viewing habits over time (see Fig.3a/b).
By mapping out the number of respondents to the length of time they have stayed in the U.S., we are able to view the trends of viewership across segments. For non-domestic viewers, we found that the longer they reside within the U.S., the more domestic content and the less foreign content they watch. In contrast, when looking at the available data for domestic viewers we see that the overall viewing trends stay relatively constant over time. Viewers of this segment are unlikely to introduce media originating from abroad unless they have already done so in the past.
Focusing primarily on the non-domestic segments, it is known that there are long term and short term non-domestics. Using the information shown here, it is possible to further segment marketing efforts on this group. New residents to the U.S. are shown to have higher levels of foreign media consumption than long term residents. As a result, marketing efforts can be focused on providing foreign content to primarily new residents as long term residents will have naturalized and shifted their habits, watching a proportionally larger amount of domestic content.
RQ2. Identify devices Used and content consumed
In this research question, we looked at device ownership and how each market segment uses their devices to see if there was a difference between the two. At the same time, do different immigrants (e.g. student visa, work visa, citizen) own different devices than US born?
- DRQ2-1: Which electronic devices do you own?
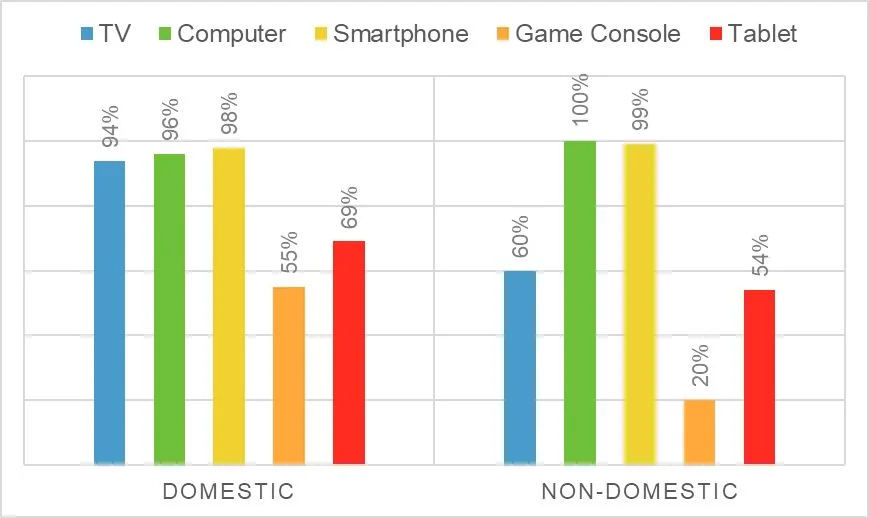
Firstly, we conducted a univariate analysis to demonstrate the ownership of devices of both market segments (please see Fig. 4). According to the result, there is no significant difference between the two market segments except TV ownership. 94% of domestic viewers have TV while only 60% of non-domestic viewers have a TV. This represents that non-domestic viewers’ lack of devices to contributes to them not subscribing to a cable service.
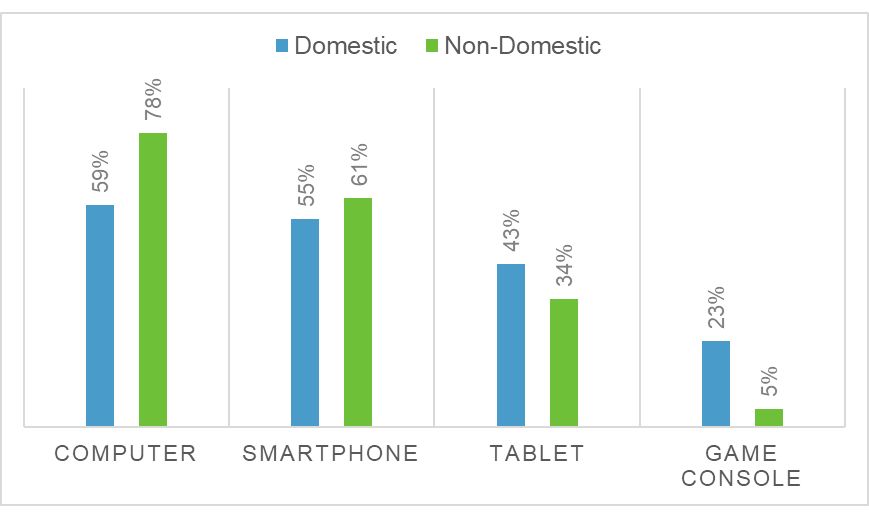
Furthermore, we looked at the devices with high a reported use of video content viewing. These devices were computers, smartphones and tablets. According to the results, the most popular device for both domestic and non-domestic viewers was computers. Smartphones take the second place (see Fig 5). Computers have high level of ownership and have high usage rate for video consumption. Comcast should pay more attention to providing streaming services through computers. Tablets do provide an alternative to focus although ownership and usage rates are low, the primary use cited for these devices is video viewing.
RQ3. Examine the viewing habits of each market segment
In order to discover viewing habits of domestic and non-domestic viewers, we finally choose two detailed research questions to represent different viewing habits between two market segments.
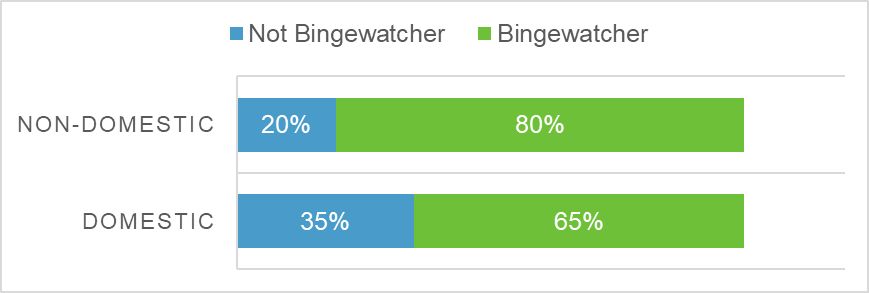
- DRQ3-4a: Do you tend to watch multiple episodes of a show in one sitting
In order to discover the viewing habits of binge watching for both market segments, we included questions about binge watching in our survey. To address this question, we conducted a univariate analysis. According to the results, 80% of non-domestic viewers binge watch while 65% of domestic viewers binge watch. In conclusion, non-domestic viewers are more willing to watch multiple episodes in one sitting, which means non-domestic viewers is a good group of customer to market this feature to. On the other hand, according to our interviews, the reason behind this is that many non-domestic viewers want to watch more content at once when watching programs from their home countries.
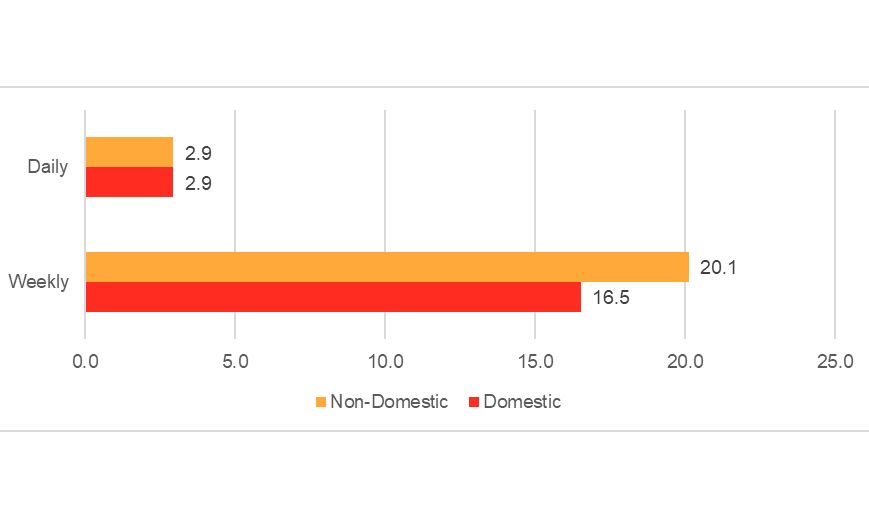
- DRQ3-5: How many hours of video programming do you estimate you watch on average
Also, we want discover the time of watching for both market segments. In this case, a univariate analysis was conducted. Based on the results, domestic viewers spent about 16.5 hours a week watching video and non-domestics spent about 20.1 hours a week viewing video content. This result is an evidence of the hypothesis that non-domestic viewers are a potential market. We also discovered that these numbers highly correlated to occupation, with interviewees who were full-time students recording the highest average viewing time. As a result, we conducted further analysis between occupation and hours of watching per week among non-domestic samples. We also use one-way ANOVA to estimate if the relationship between hours of watching per week and immigration status is significant. The outcome shows there is a significant relationship. These tables tell us that for non-domestic viewers, occupation is a key factor to viewing hours. Students spend a significant amount of time watching video weekly due to the fact that they have more free time than other people with other immigration status. As a result, students are potential market to Comcast focus on.
RQ 4. Cable subscription status and effect of subscription incentives
This is a vital part of our project - we want to figure out the cable subscription status and subscription incentives of participants.
- G2: Are you currently subscribing to a cable TV service?
Firstly, we conducted a univariate analysis to demonstrate the subscription status of participants. In our dataset, 70% of domestic viewers subscribe for cable services while 30% of them did not. For non-domestic subscriber, 46% of them did not subscribe to any cable services and 45% of them did. Accordingly, we also found out that there is a significant relationship between cable subscription status and origin of viewers (see Fig 9). Furthermore, in the non-domestic market segment, we also figure out there is a significant relationship between immigration status and subscription status. According to our dataset, the most prominent outcome is that most citizens will subscribe to cable services and most students will not (see Fig 10.).
- DRQ4-2: Which describes your reason(s) for not having a cable subscription?
Trying to discover the reasons of not having a cable subscription, we provided options of pricing, lack of interest, customer service, not available, using family/friends subscription, prefer streaming service, don’t like contract terms and other reasons with a text box in the survey. In this case, a univariate analysis was conducted . We ran the analysis based on different cases (domestic & non-domestic), and the three most important reasons for domestic viewers were pricing, disliked contract terms and preferred streaming services. In the opposite, for non-domestic viewers, top three reasons were lack of interest, preferred streaming services and pricing. From this research question, we can conclude that non-domestic viewers care more about content than pricing. On the contrary, domestic viewers pay more attention to issues regarding pricing and contract terms.
- DRQ4-3: Would you sign-up for a cable subscription package that included the lease of a TV (similar to a phone contract)
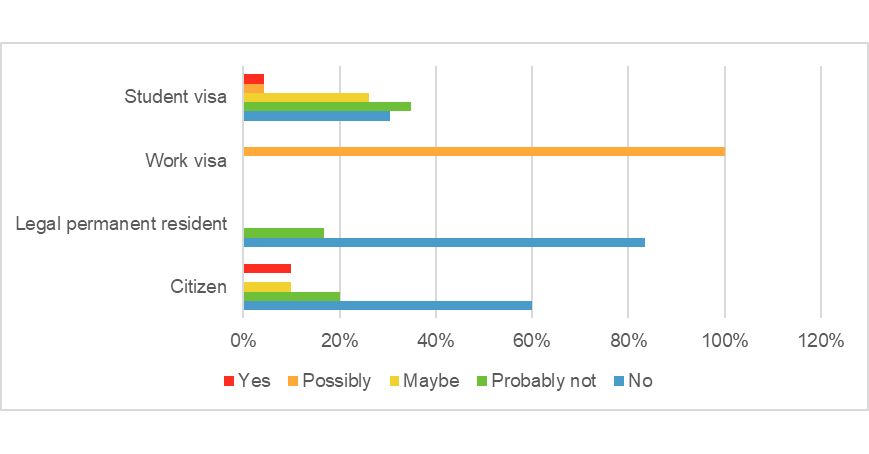
Lastly, we tested the incentives of subscribing to a new package with a TV-leasing. Unfortunately, the majority percentage of both domestic and non-domestic participants answered that they are not interested in this package. However, some people were still interested in starting subscription with a TV leasing. Since most non-domestic viewers did not have a TV, we detailed our analysis by narrowing down the population to just responses from non-domestic participants. The result shows that student-visa-holders and work-visa-holders have a higher level of incentive than person who are legal permanent resident and citizens . In conclusion, cable subscription with TV-leasing is more likely to be accepted by international students and employees with work visas.
RQ5. Are segments interested in Sharing Premium content?

Fig 11. Interest In Premium Sharing
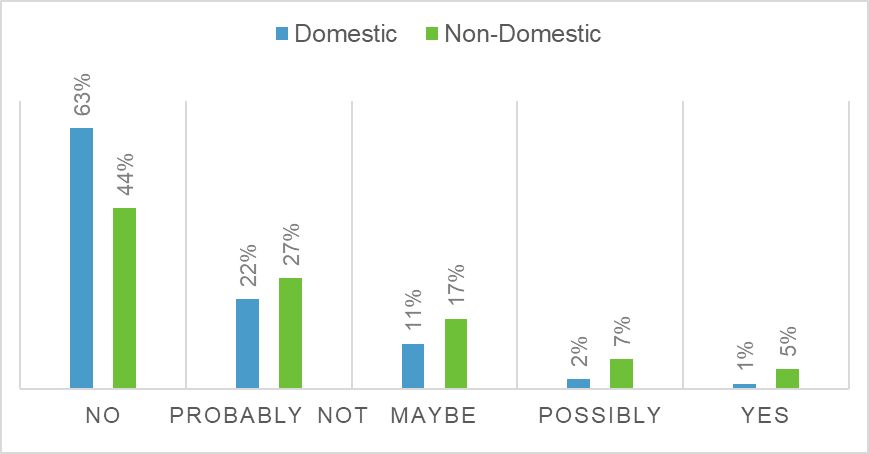
This research question was included at the suggestion of Comcast following an initial review of the research proposal. Because this service is hypothetical and not something that currently exists and would therefore have a greater likelihood of familiarity, it's possible respondents had different interpretations of the meaning of the question, which could had an impact on interest. We conducted a univariate analysis to count the frequency of the answers from each market segments . Most participants from both segments answered that they are not interested in premium sharing. However, there are some people who are interested in premium sharing even at a high price point. In conclusion, we recommend Comcast to conduct a further research to discover the feasibility of premium sharing services.
CONCLUSIONS AND RECOMMENDATIONS
The following section is based upon our results from the exploratory and descriptive research performed throughout this project. This research along with the statistical analyses gathered have brought us to these conclusions and recommendations from which are meant to act as bases for further research and development. It can also serve as a guide for future promotions and/or campaigns. The following conclusions and recommendations have been separated amongst two categories, the non-domestic viewer and hypothetical proposals. The conclusions are based upon combined findings for both categories.
Conclusions
According to the results gathered, domestic viewers will tend to watch mainly domestic content and are unlikely to change their habits as they get older. The older population samples watched the same proportion of foreign and domestic programming as younger population samples. There is a distinct trend of viewership ratings of domestic programming for non-domestics that increases over time while foreign content viewership decreases, assuming residents continue residing in the U.S. Both these segments are the same in terms of the genres preferred with the main preferences being comedy, drama and series.
Device ownership across the market segments are roughly equal with the notable exceptions of lower televisions and gaming consoles ownership among non-domestic viewers. Although computers and smartphones ownership are the highest among the market segments, the use of these devices are primarily for other uses with video viewing ranking third and fifth for each device respectively. In contrast, tablet owners stated video viewing as the primary use for their devices.
When looking at the amount of content that is watched consecutively (binge watching), non-domestics showed a significantly higher tendency of binge watching with 15% more of the respondents reporting to binge watch compared to domestics (65%). Analyzing the segments by the length of time spent watching video content shows that on average there is no significant difference between the viewing habits of the segments. However, non-domestics have self-reported to watch a higher amount of video content per week in contrast to domestics; watching up to 3.5 hours more than domestics.
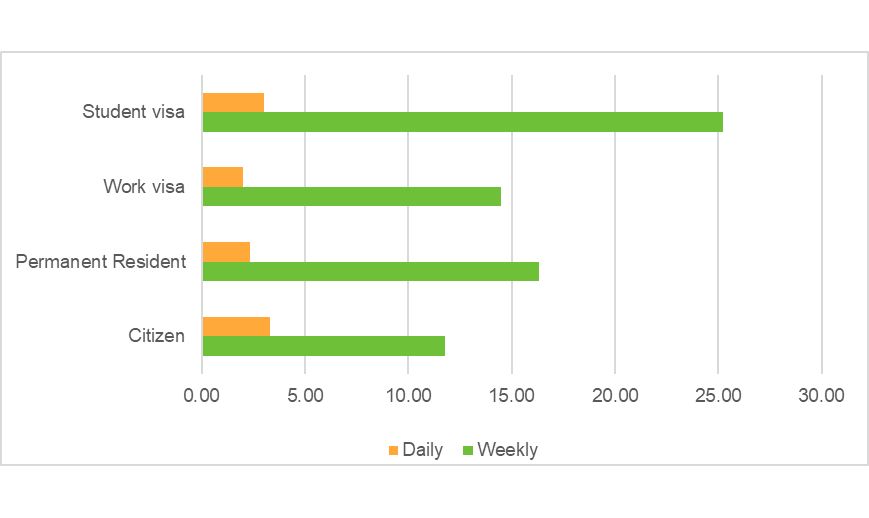
Splitting the non-domestic market segment by the status of their immigration provides more detail into who among this segment watches more video content. Student visa holders were shown to be the most prolific viewers of media (25 hours per week), exceeding other categories by around 10 hours.
Among our non-domestic respondents, subscription rates were on the low side with 45% subscribed to cable services. Domestic respondents showed higher subscription rates at 70%. Initiatives to increase subscriptions though TV leases showed disappointing results of interest in leasing a TV. Among non-domestics, student visa and work visa holders were shown to be the most interested in the program.
Our initiative to introduce premium content sharing was shown to be unpopular among our respondents. Our data however showed a consistent level of positive interest in the program across most price points. Although only representing a small portion of respondents, the consistent level of interest may be useful in framing future research.
Recommendations
With the scale and the scope of this project, results are more likely to be basic and ideally suited for preliminary conclusions. Based on the viewing habits of the market segments and their preference of video content, further action should be taken to cater to non-domestic viewers residing in the U.S. Managers should use these information to provide programming suitable for the demographic based on the expected length of stay in the U.S. Newcomers to the U.S. would ideally receive packages with equal levels of foreign and domestic content. Longer residents could be offered packages more similar to existing packages tailored to domestic viewers.
In light of the devices used, with the high level of use and ownership on smartphones and computers, Comcast should provide multiplatform support as well as expanding features and capabilities with these devices. A potential marketing niche that could be focused on are tablets as tablet owners use their devices mainly for video viewing. This could provide very focused advertisement campaigns if more research was done on identifying the users of these devices.
The same could be said for the binge watching habits of non-domestics. With their higher levels of video consumption overall, they are more likely to spend continuous periods of time viewing video. This can lead to a potentially higher level of exposure to advertisements. Although both markets spend a significant portion of time watching video content, be it binge watching or not, the increase in exposure time is a valuable consideration for managers. This is especially true when considering that many newly arrived non-domestics will be at a point where new shopping and purchasing habits are being formed and are at their most influenceable. This focus can be further narrowed by targeting international students (student visa holders) in particular as they are shown to be one of the most prolific viewers among non-domestics.
As interest levels in our proposals for leased TV sets and premium content sharing were quite low, it is advised that further research be done before any action is taken on these results. There were some levels of interest for both proposals and with the proper marketing pitch, levels of interest could be raised to a level where it is considered profitable.
References:
- American Press Institute. (2015). How Millennials use and control social media. Retrieved March 16, 2015, from https://www.americanpressinstitute.org/publications/reports/survey-research/millennials-social-media/
- Digitalsmiths White Paper (2015). The War Between OTT and Pay-TV. Digitalsmiths. Digitalsmiths (2016). Video Trends Report Q2 2016. Digitalsmiths.
- eMarketer. (2014). Millennials social media posts influence peers to buy new products. Retrieved February 4, 2014, from http://www.emarketer.com/Article/Millennials-Social- Media-Posts-Influence-Peers-Buy-New-Products/1010576.
- Forbes. (2015). 2016 Is the Year of the Millennial Customer: Is Your Customer Experience Ready? Retrieved November 14, 2015, from http://www.forbes.com/sites/micahsolomon/2015/11/14/2016-is-the-year-of-the-millennial-customer-heres-how-to-be-ready/#1b307b186e72.
- Gambino, C. P., Grieco, E. M., Acosta, Y. D., & Gambino, C. P. (2014). English-Speaking Ability of the Foreign-Born Population in the United States: 2012 (United States, U.S. Census Bureau). Washington, D.C.: U.S. Census Bureau.
- Globalwebindex. (2015) 80% of internet users own a smartphone. Retrieved January 5, 2015, from http://www.globalwebindex.net/blog/80-of-internet-users-own-a-smartphone.
- Horowitz Research (2016). State of Cable & Digital Media: Multicultural Edition. Horowitz Research
- O'Brien, S. A. (2015, April 13). High-skilled visa applications hit record high. Retrieved September 26, 2016, from http://money.cnn.com/2015/04/13/technology/h1b-cap-visa/
- Pew Research Center. (2015) Technology Device Ownership: 2015. Retrieved October 29, 2015, from http://www.pewinternet.org/2015/10/29/technology-device-ownership-2015/
- Informitv. (2016, July 13). 1 in 4 US homes without cable or satellite. Retrieved September 27, 2016, from http://informitv.com/2016/07/13/1-in-4-us-homes-without-cable-or-satellite/
- Informitv. (2016, September 26). Multiscreen Index shows America’s Loss. Retrieved September 27, 2016, from http://informitv.com/2016/09/26/multiscreen-index-shows-quarterly-loss-in- americas/
- Kressmann, J., Pearson, J., Minsker, M., Rotondo, A., Verna. P. (2015). US Millennials and Video. Marketing Charts. (2016) Traditional TV Viewing: What a Difference 5 Years Makes. Retrieved July 5, 2016, from http://www.marketingcharts.com/television/are-young-people-watching-less-tv-24817/
- McCarthy, A. (2016). US Millennials More Likely to Subscribe to Netflix than to Cable TV. eMarketer.
- Smart Insights. (2016) Mobile Marketing Statistics Compilation. Retrieved April 27, 2016, from http://www.smartinsights.com/mobile-marketing/mobile-marketing-analytics/mobile-marketing-statistics/